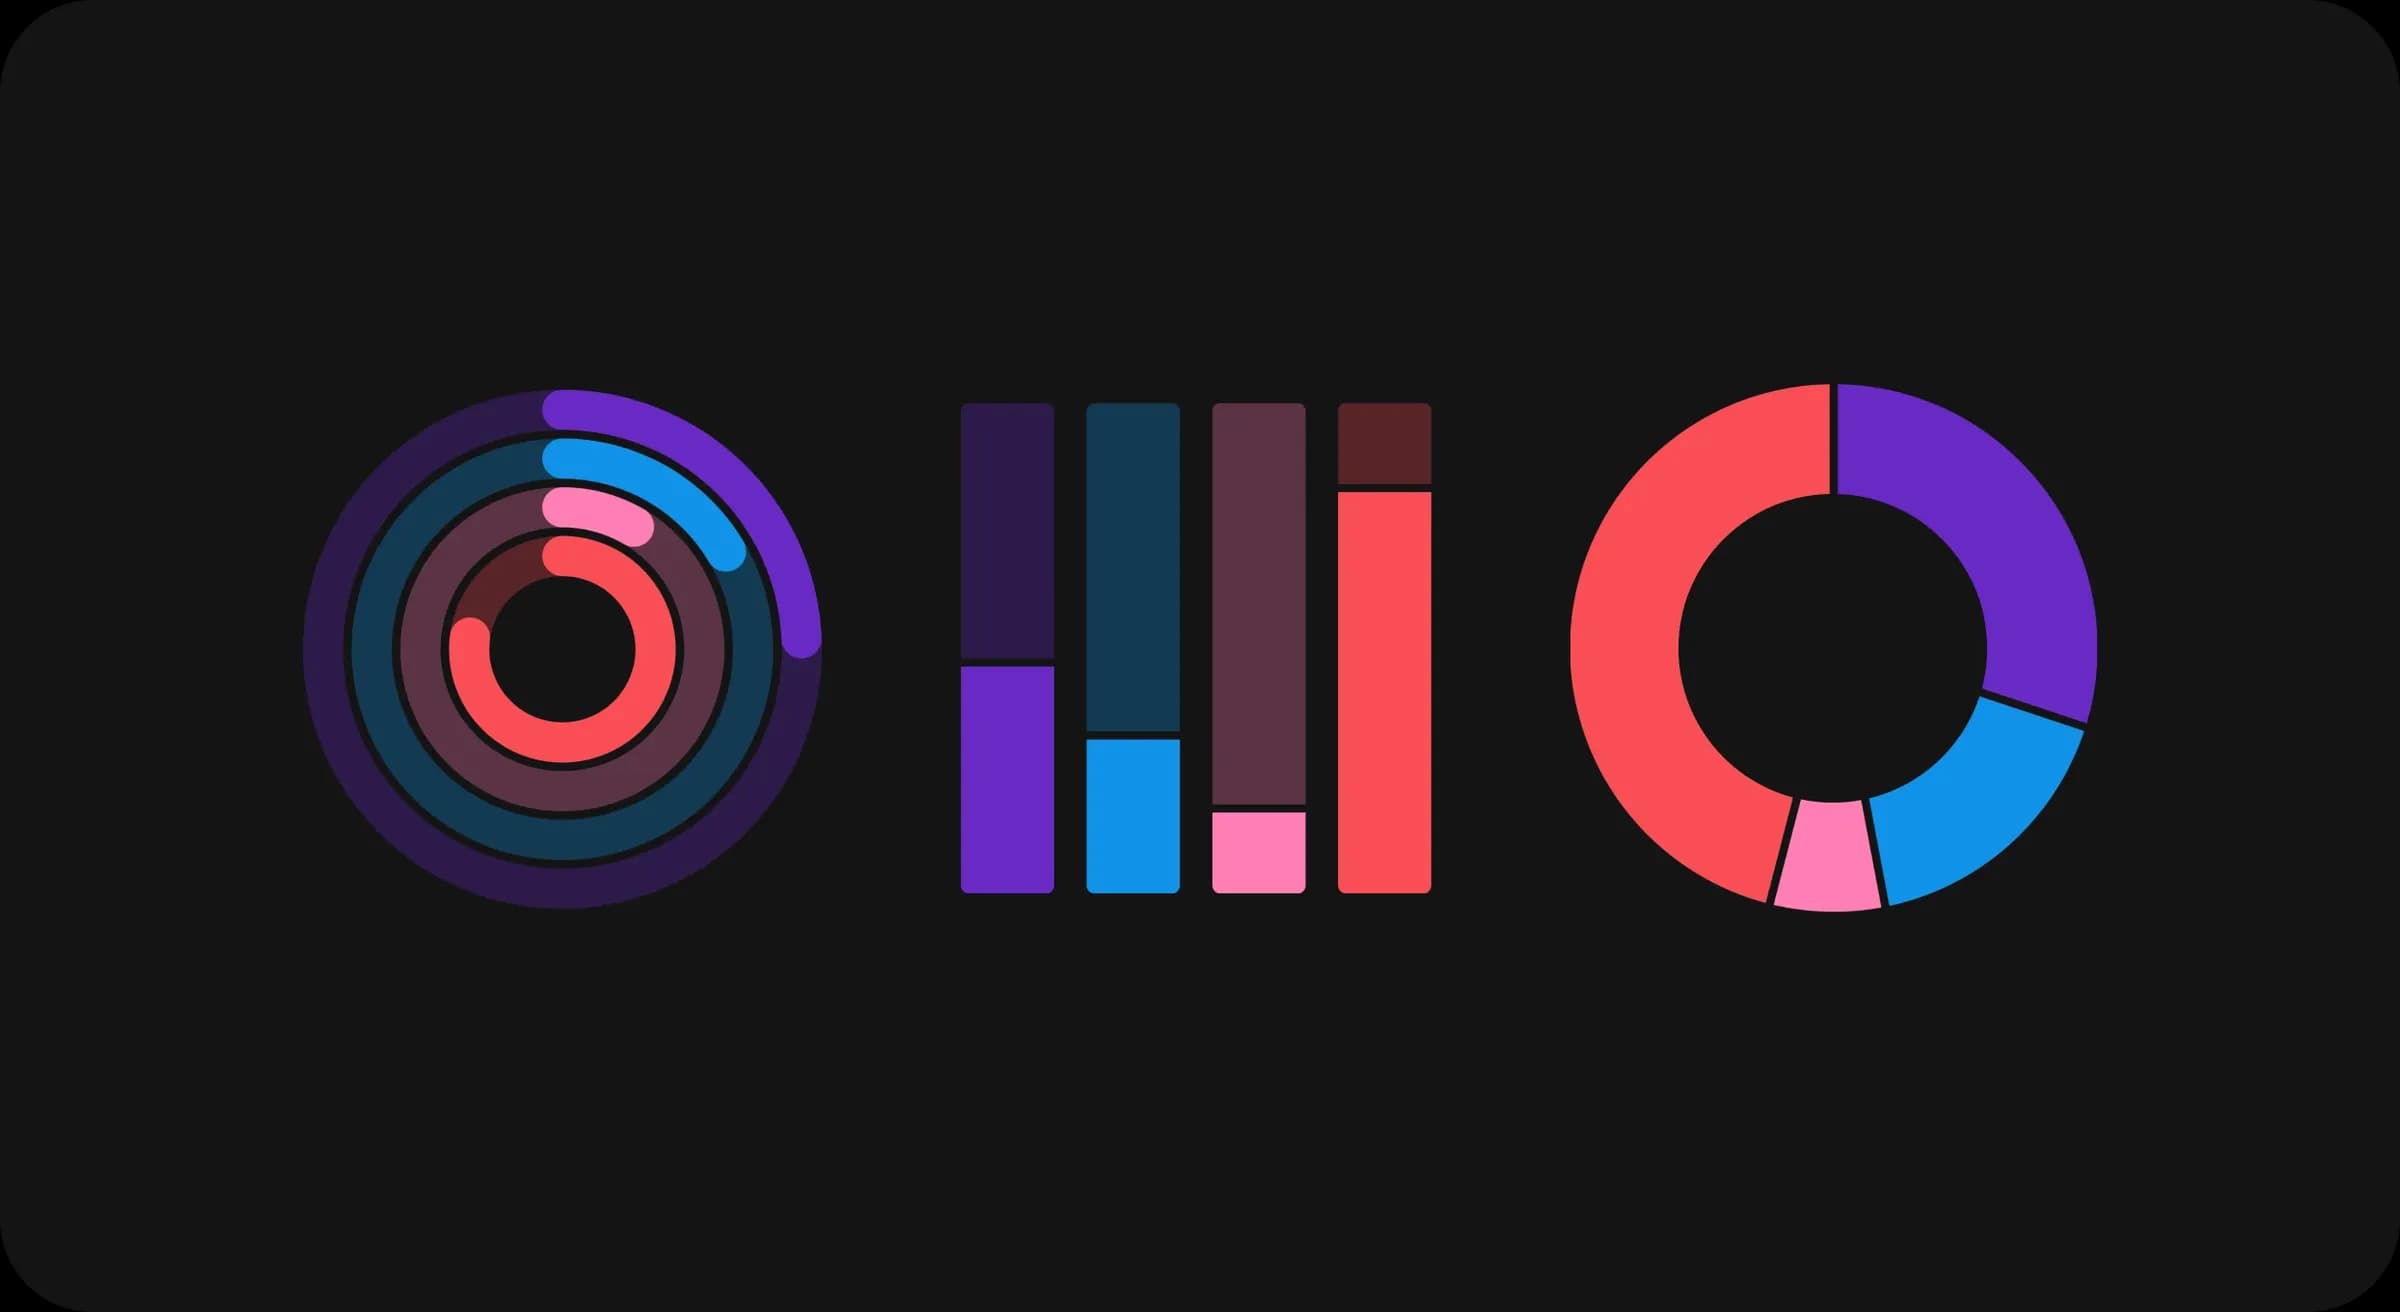
Different chart types
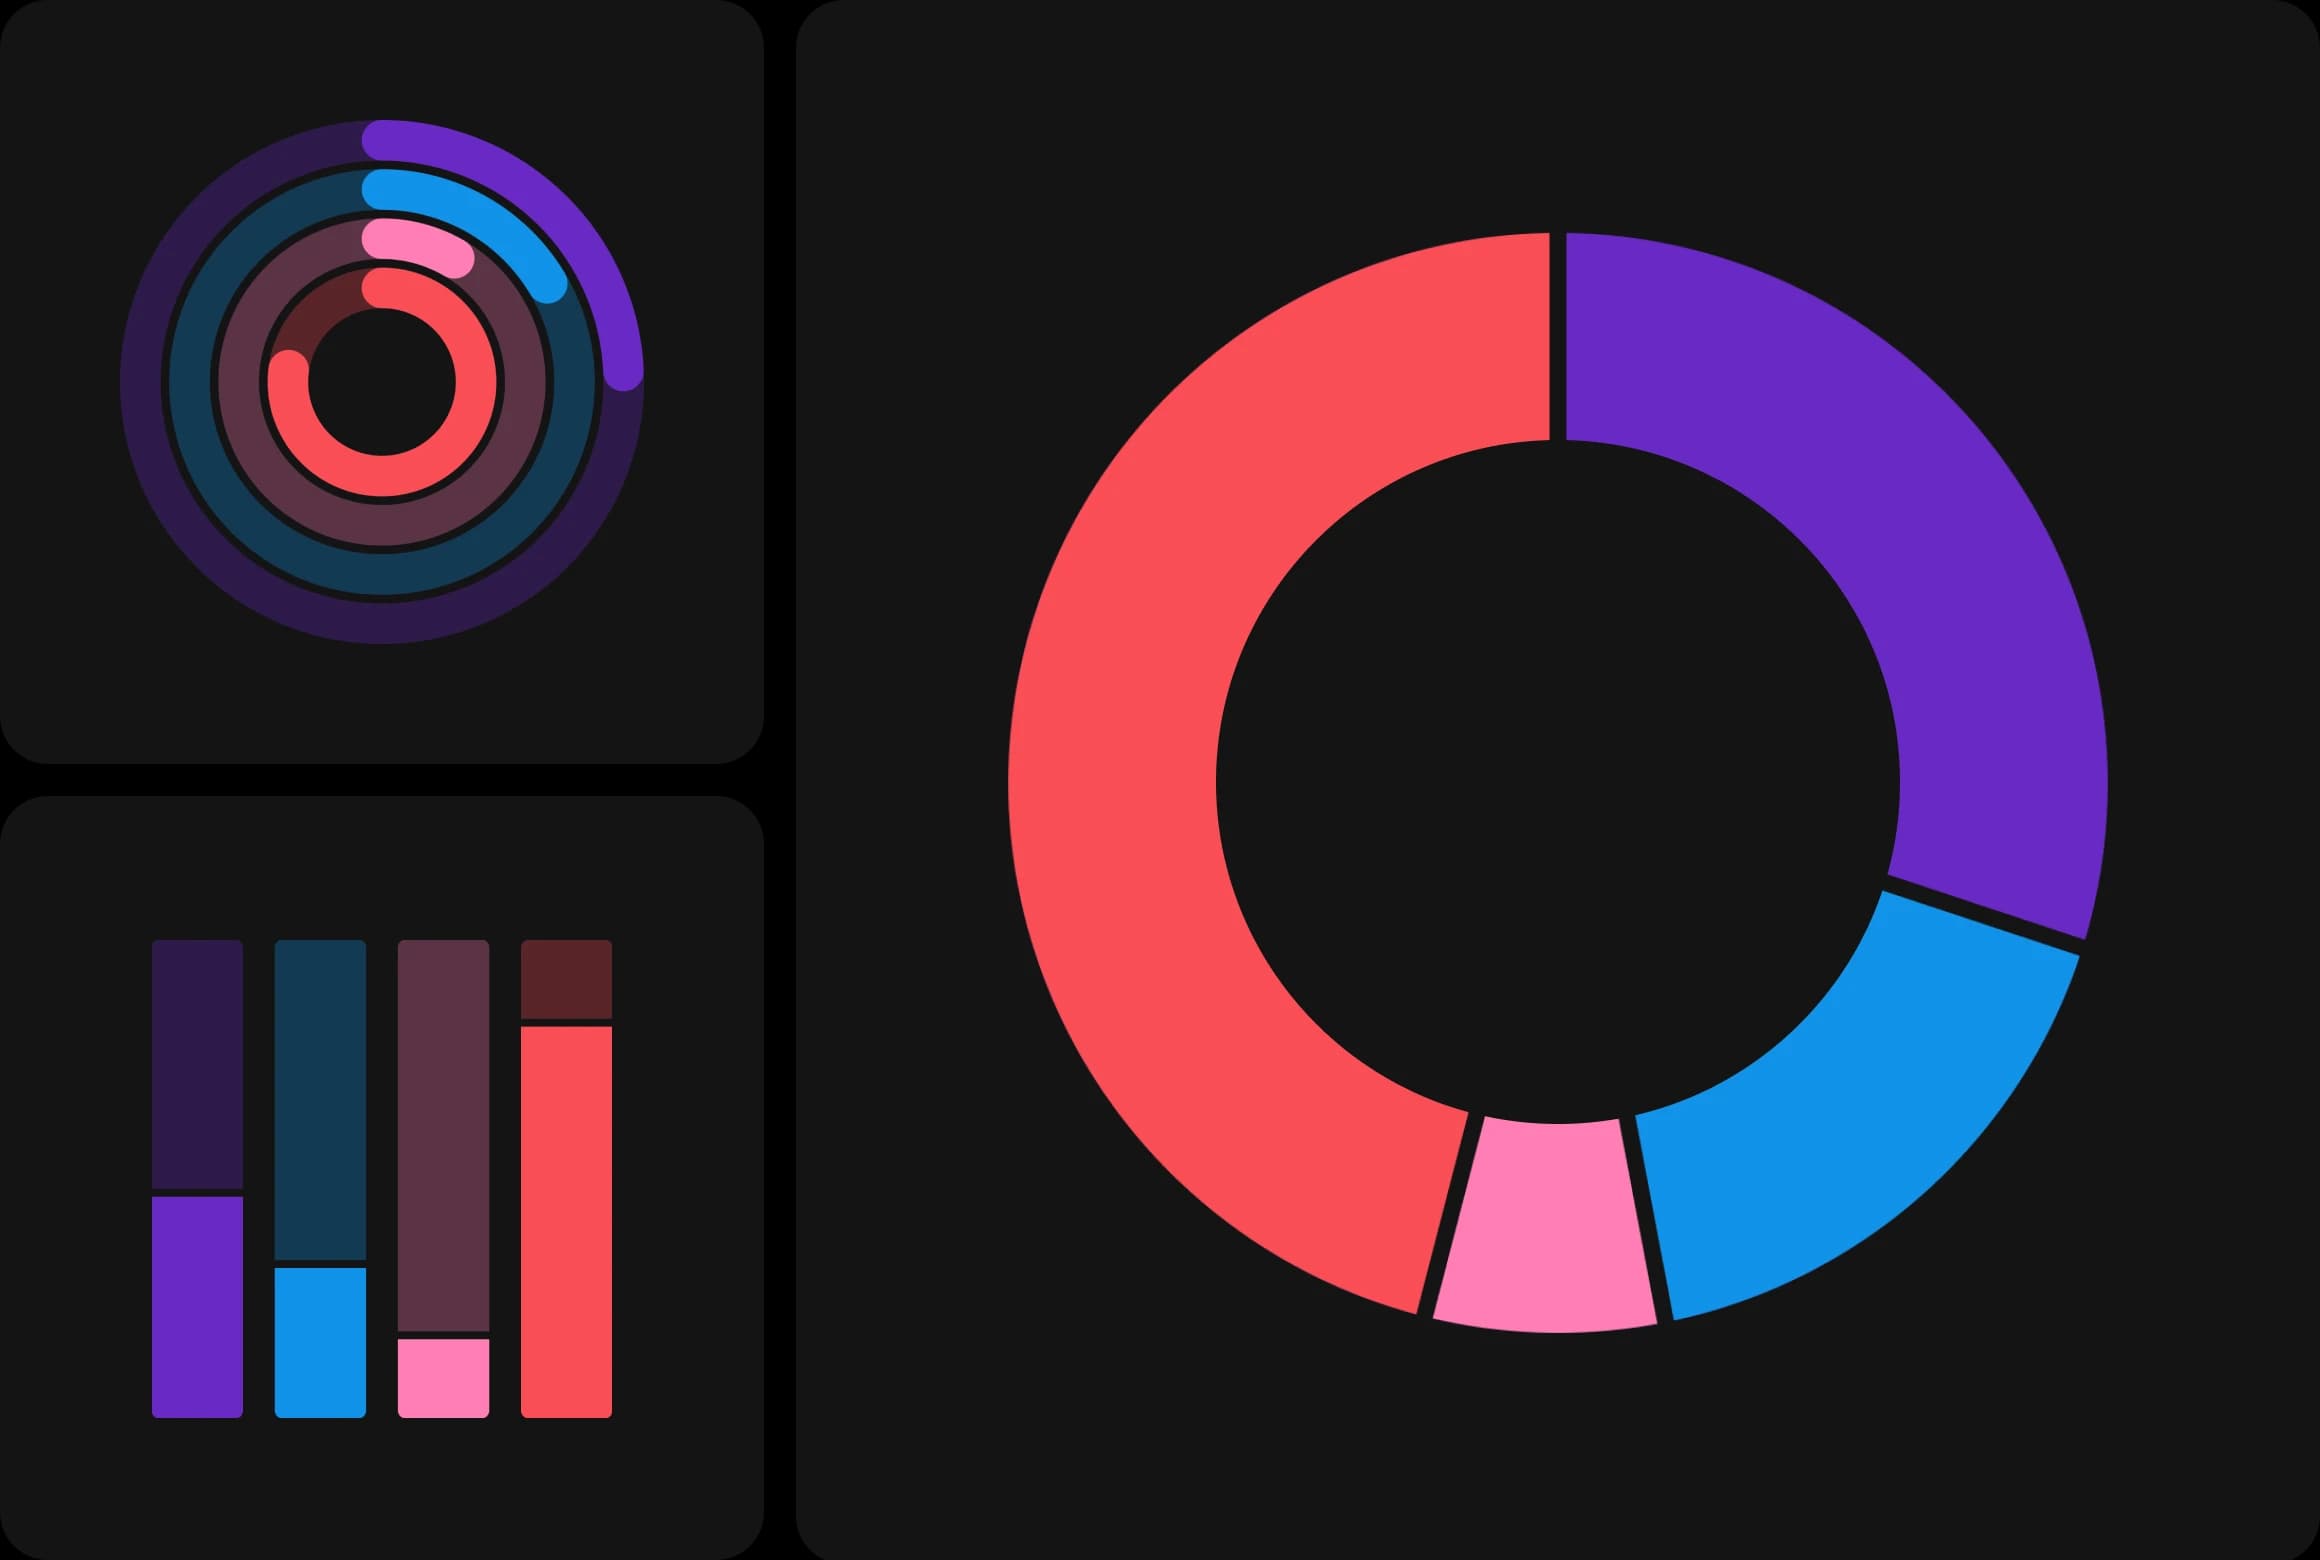
Radial charts
These charts are popular on smartwatches and are also known as radar charts or spider charts. They use a circular layout to display the data. Each axis represents a different category, and data points are connected to form a polygon, showing relationships among them.
Bar charts
Bar charts are straightforward, using horizontal or vertical bars to represent data values. The length or height of each bar correlates directly with the value it represents, making it easy to compare different data points.
Donut charts
These are essentially pie charts with a hole in the middle. They offer a clear and visually appealing way to represent parts of a whole, with the segmented ring allowing for quick comparisons.
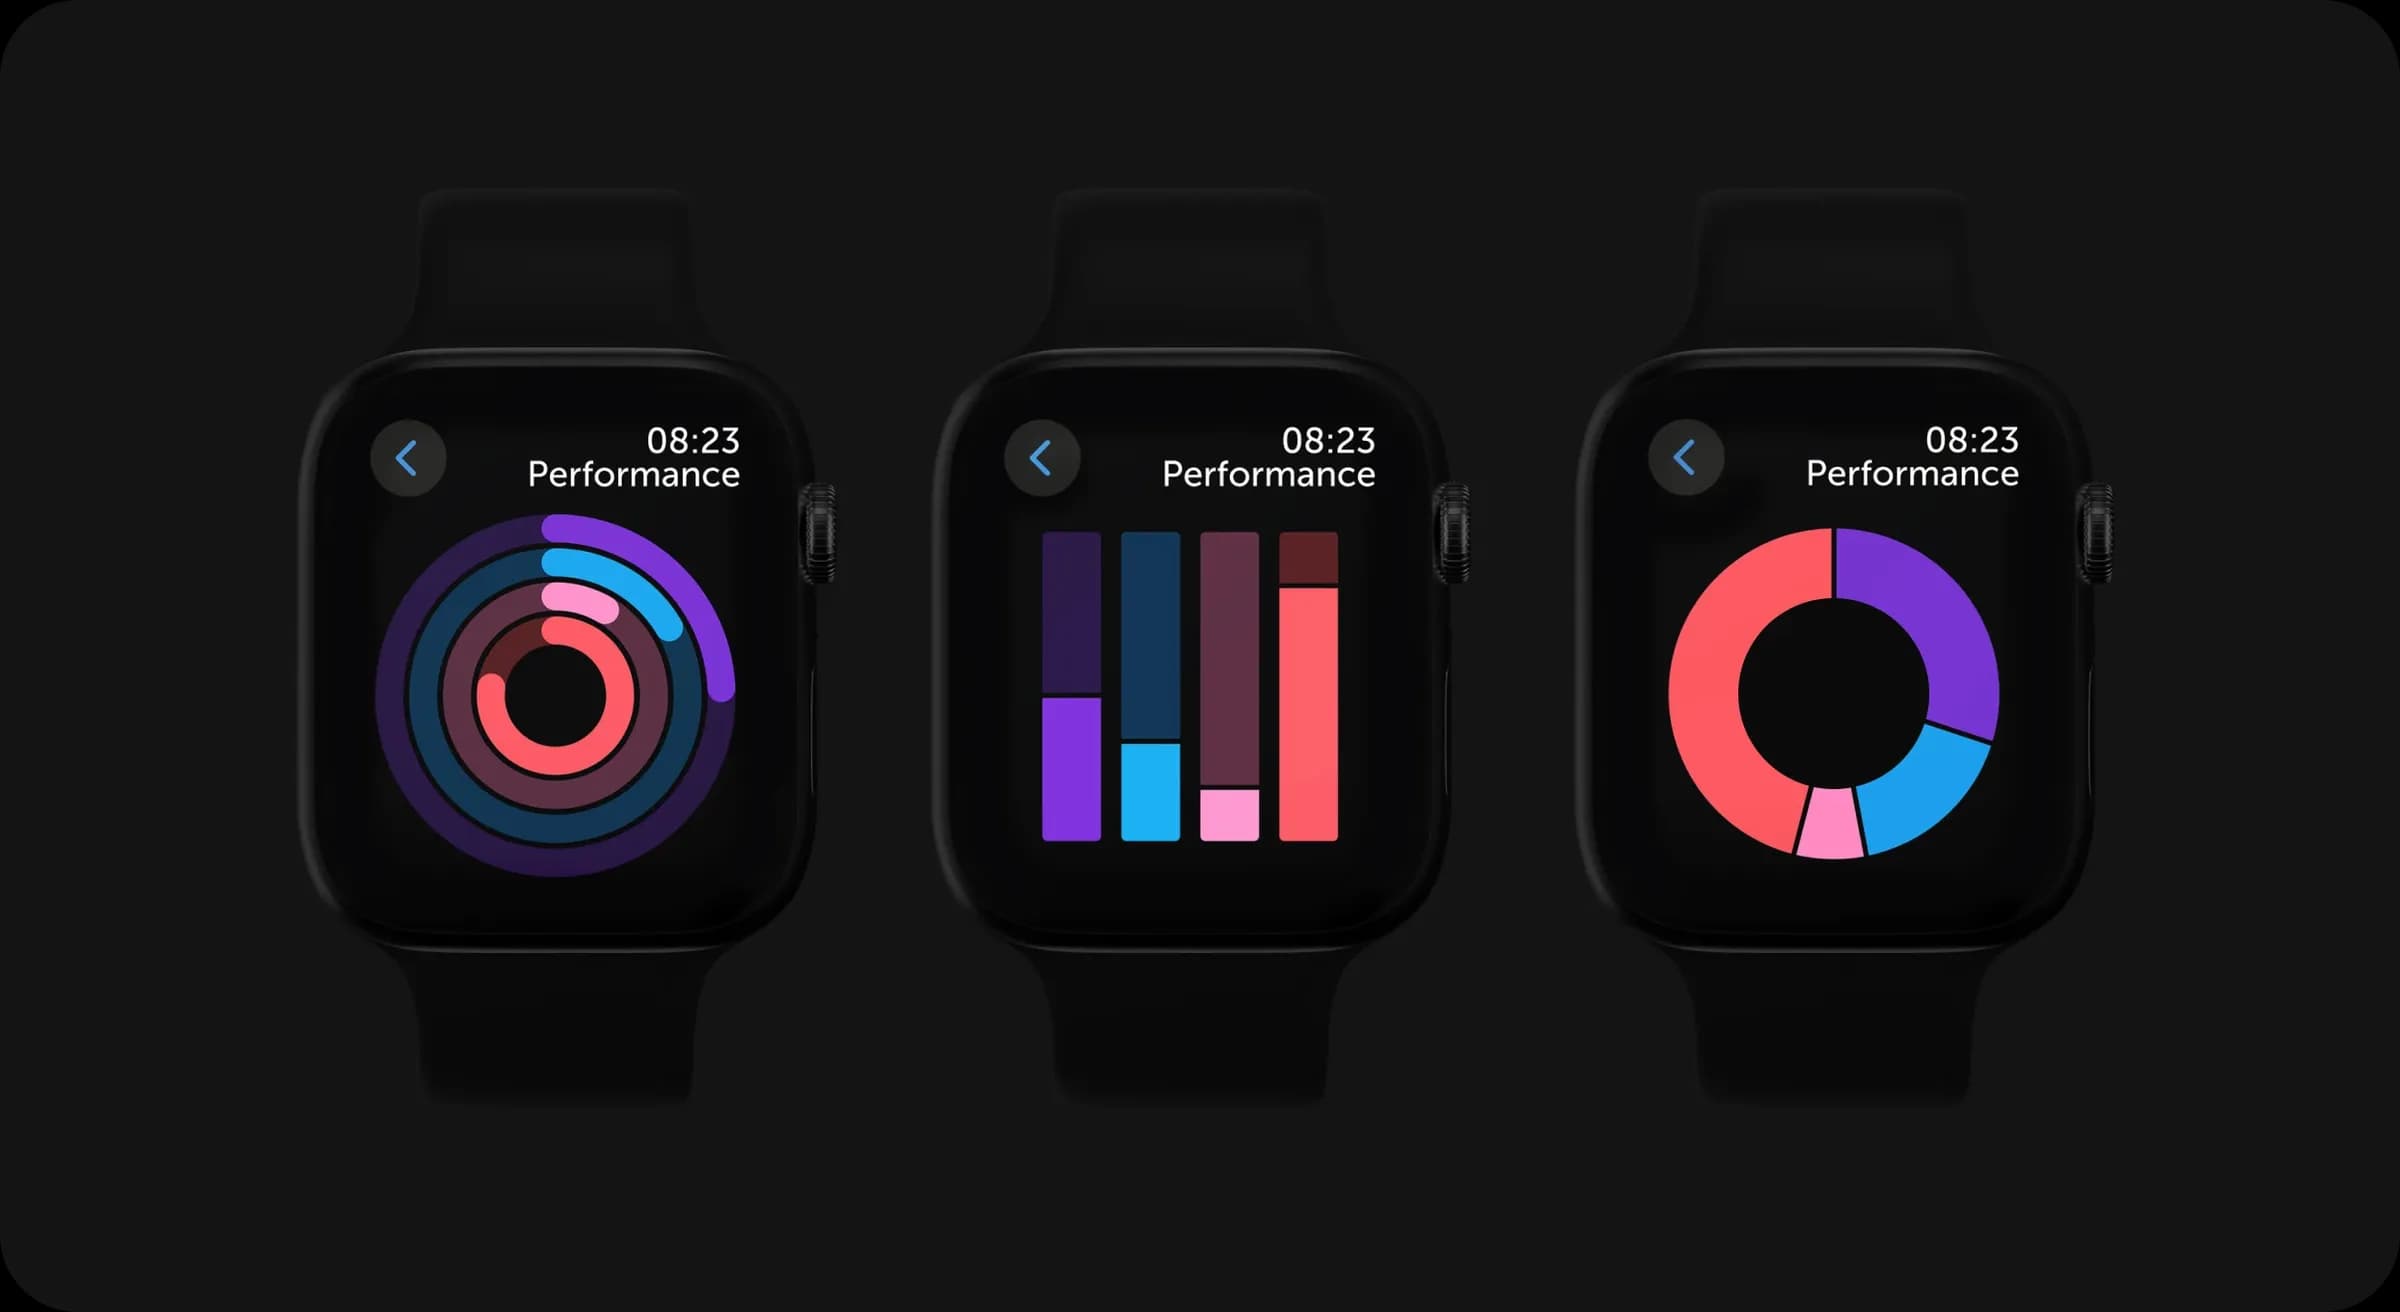
Chart performance on smartwatches
As the amount of data displayed increases and the screen size decreases, significant differences between the three graph types becomes apparent.
Radial charts
Despite their frequent use in mobile apps, radial charts are not the best choice for smartwatches. The circular layout can complicate quick data comparisons, especially with larger datasets. Overlapping and converging lines can create visual clutter, making it difficult to discern individual data values accurately and quickly.
Bar and donut charts
These charts consistently outperform radial charts as data complexity grows (link to study). Their designs enable more precise and faster comparisons. The smaller the screen, the better the donut chart performs, making them ideal for the limited real estate on the screens of smartwatches.
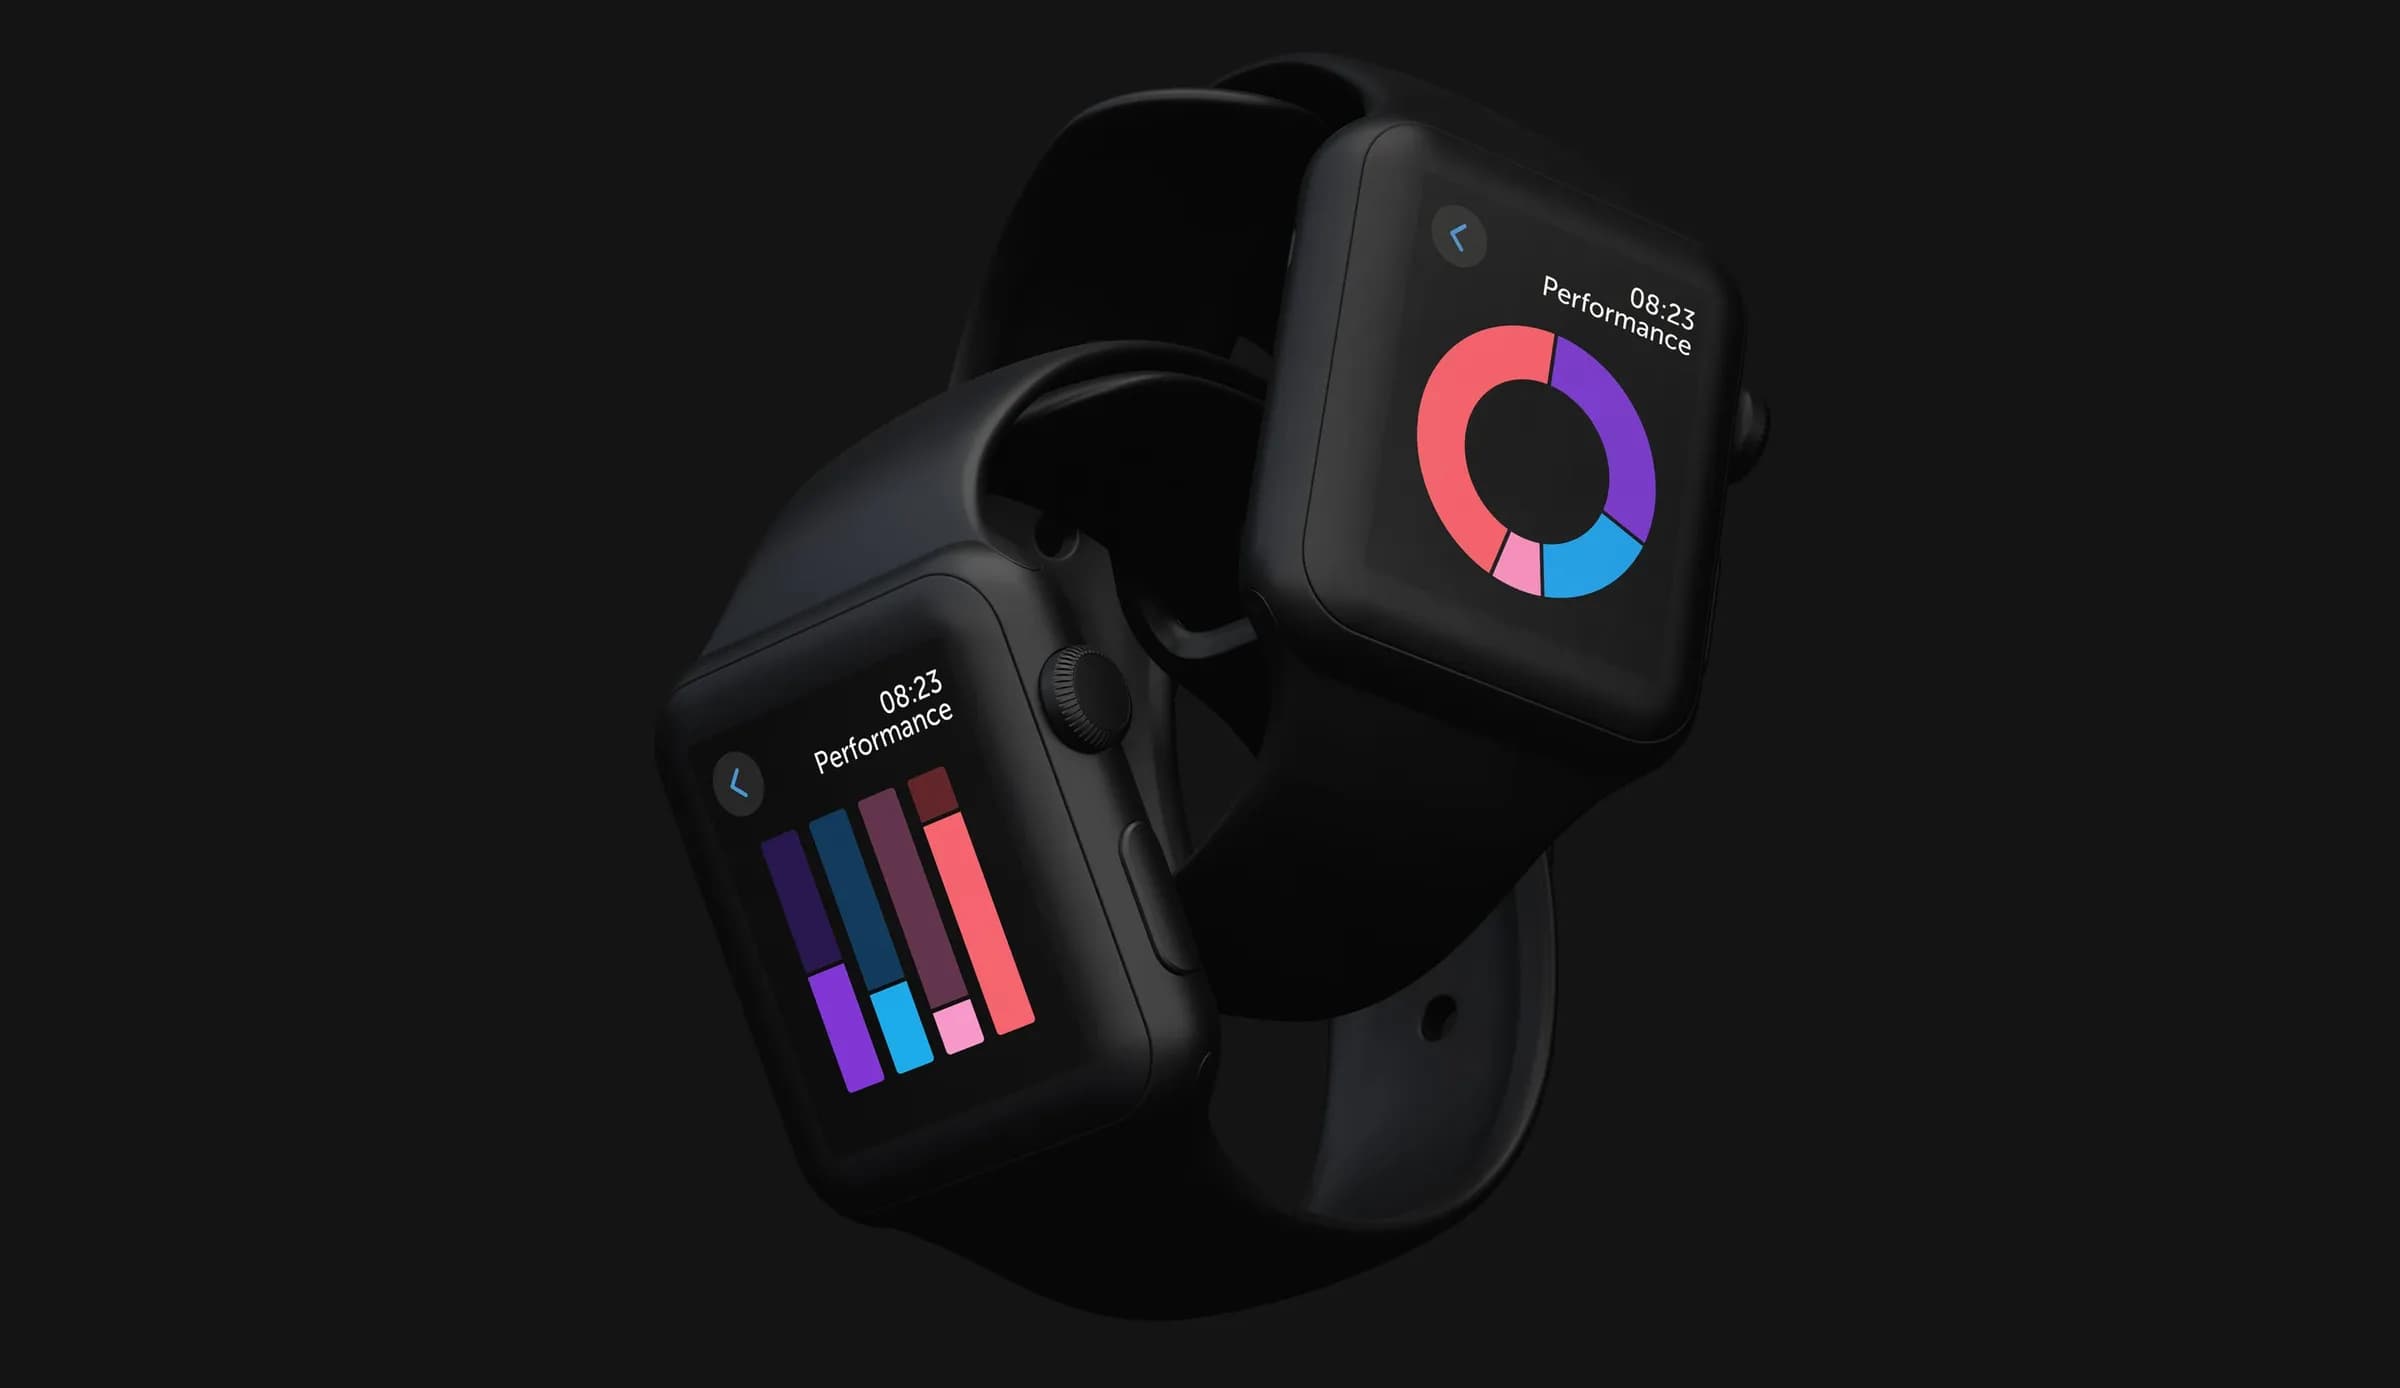
Practical tips
To create effective data visualisations on smartwatches, it’s crucial to understand the strengths and weaknesses of each chart type. Here are some tips:
1 – Keep it simple
For small datasets, simplicity is key. Bar and donut charts offer clear and quick comparisons, ensuring users can interpret the data easily.
2 – Consider alternatives for radial charts
As the number of data values increases and the screen size decreases, radial charts become less effective. Bar and donut charts provide a more intuitive and faster way to compare multiple data points, avoiding the visual clutter of radial charts.
3 – Prioritise user experience
Choose chart types that enhance readability and reduce cognitive load. This is especially important on small screens where space is limited.
4 – Use colour intentionally
Incorporate clear colour coding to help users quickly distinguish between different data values. Ensure the colour palette is accessible and colorblind-friendly to cater to a broader audience.
5 – Test and iterate
Continuously test your visualisations with real users to gather feedback and make necessary adjustments. User feedback is invaluable in refining the effectiveness of your data visualisations.
Conclusion
Effective data visualisation on smartwatches is crucial for user interaction, significantly impacting how well information is communicated. Bar and donut charts are superior for displaying multiple data values, especially as complexity increases, while radial charts are less effective. Understanding these differences helps create more efficient, user-friendly interfaces that enhance the overall smartwatch experience.