Why good data visualisation matters
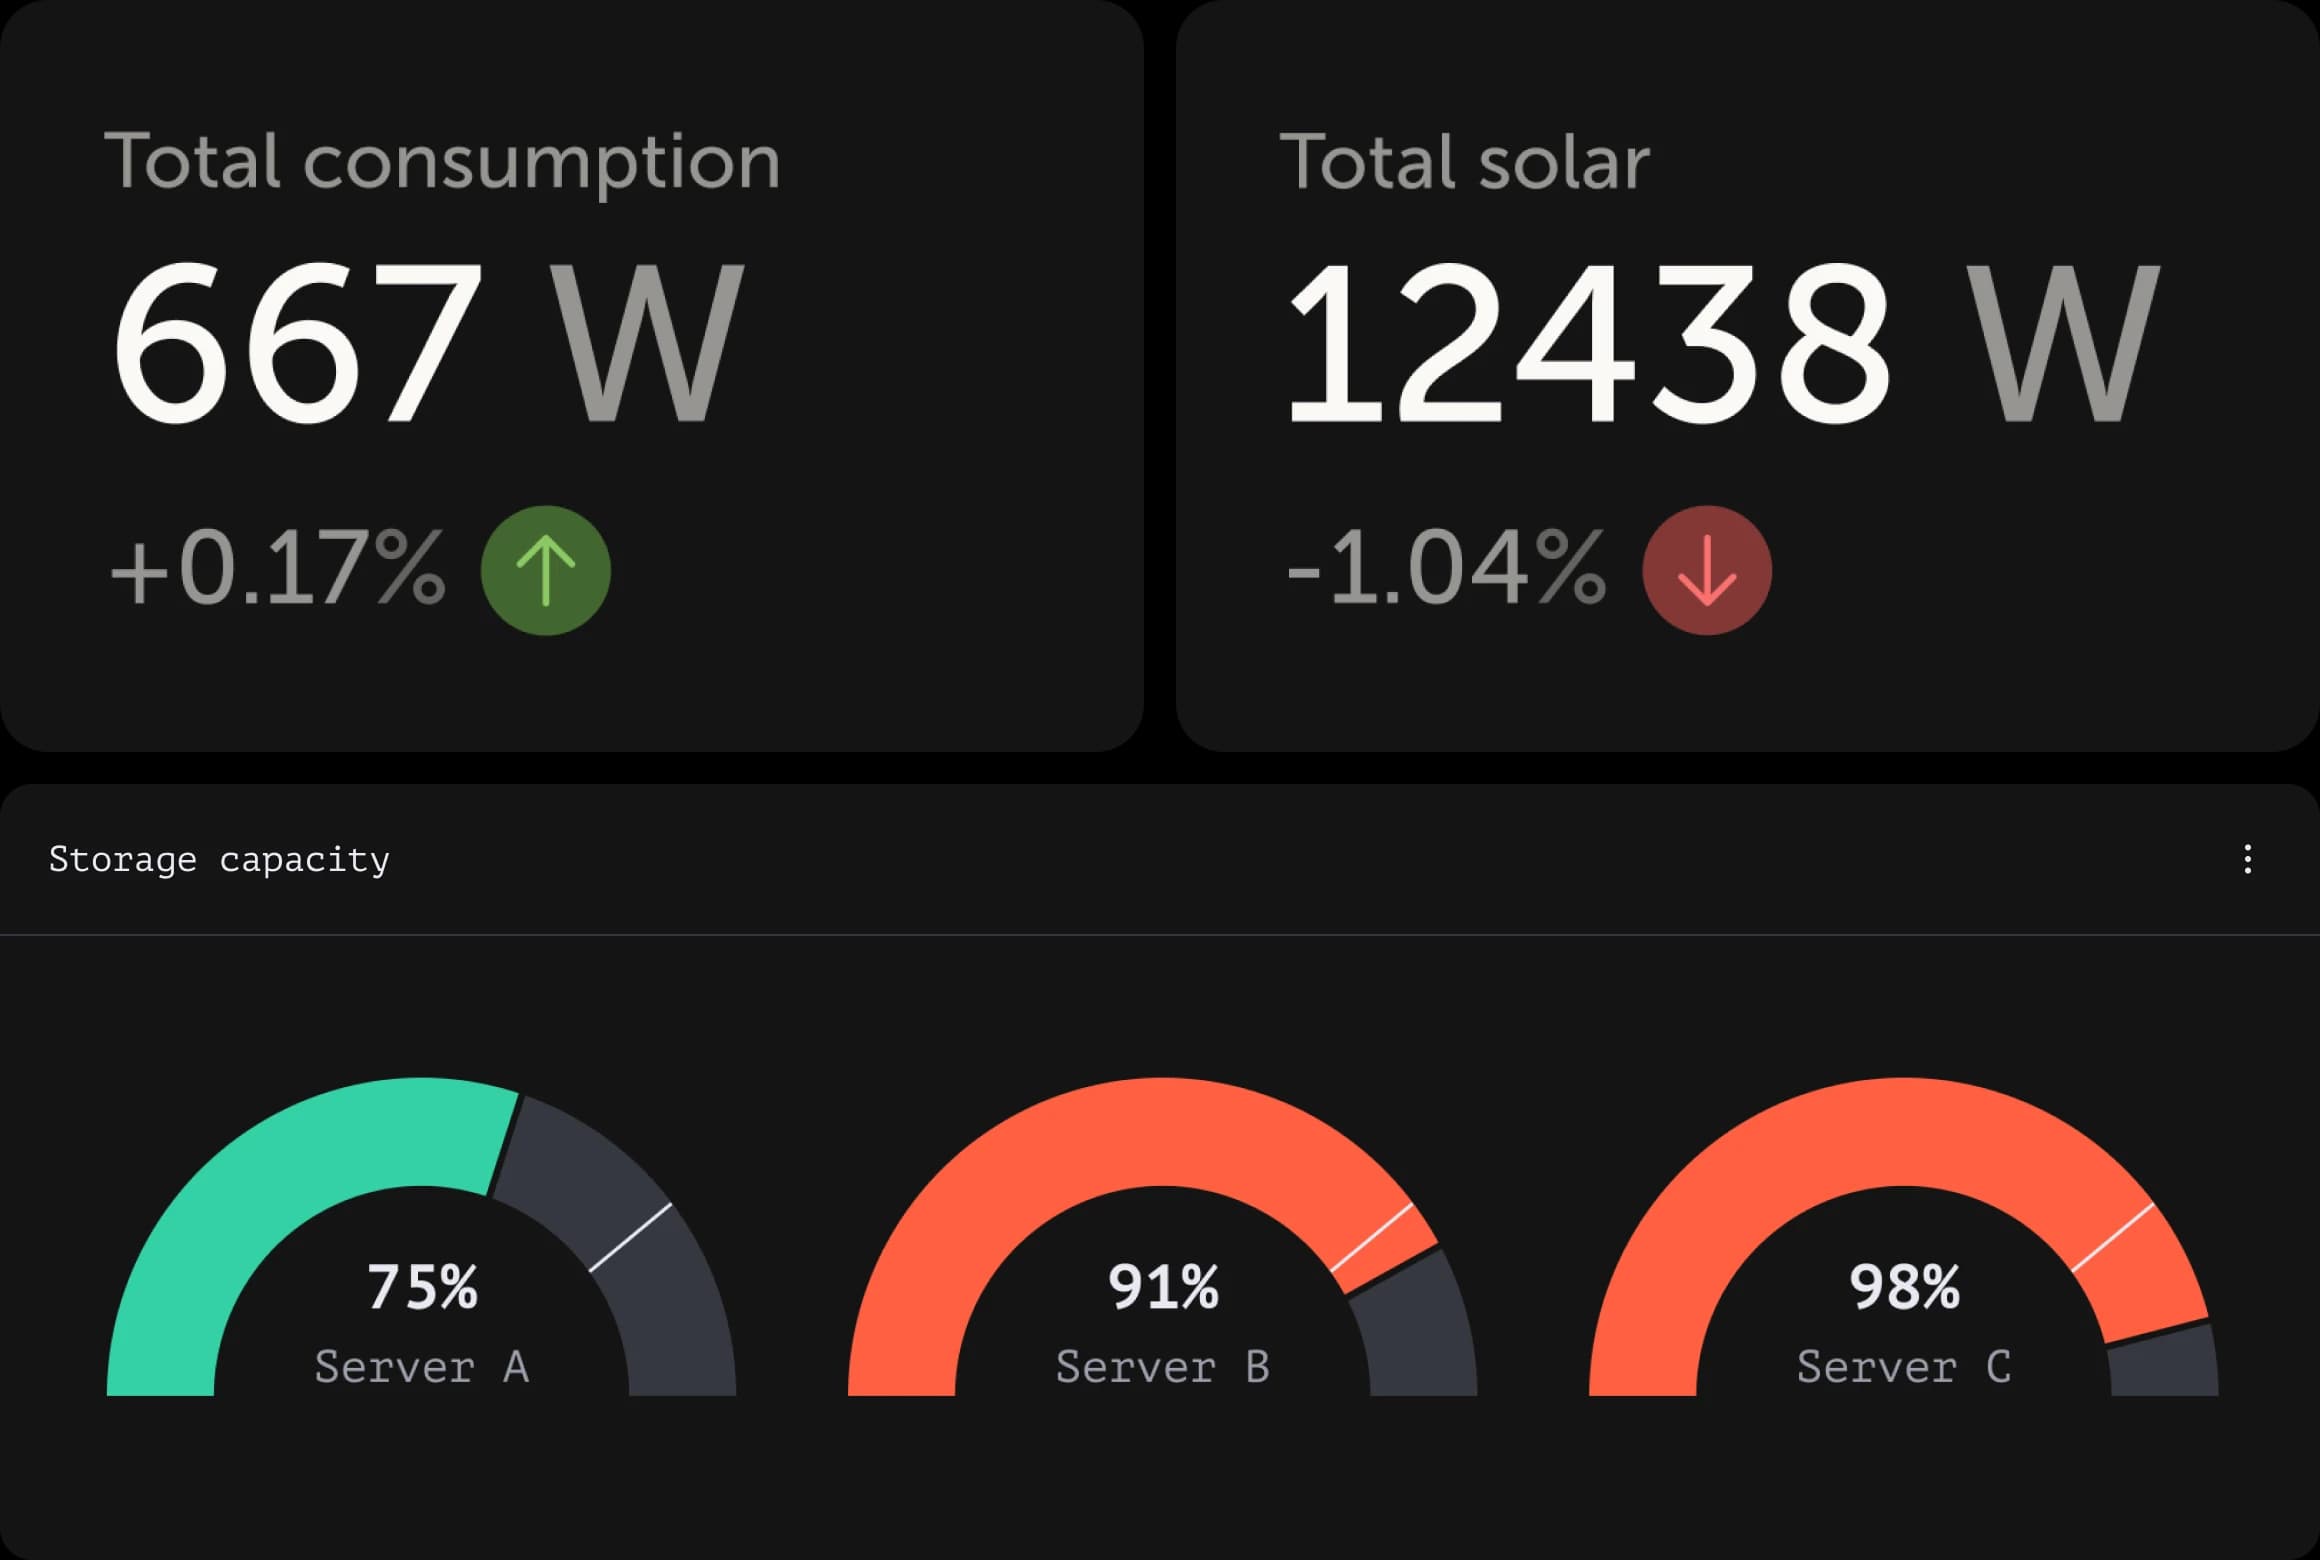
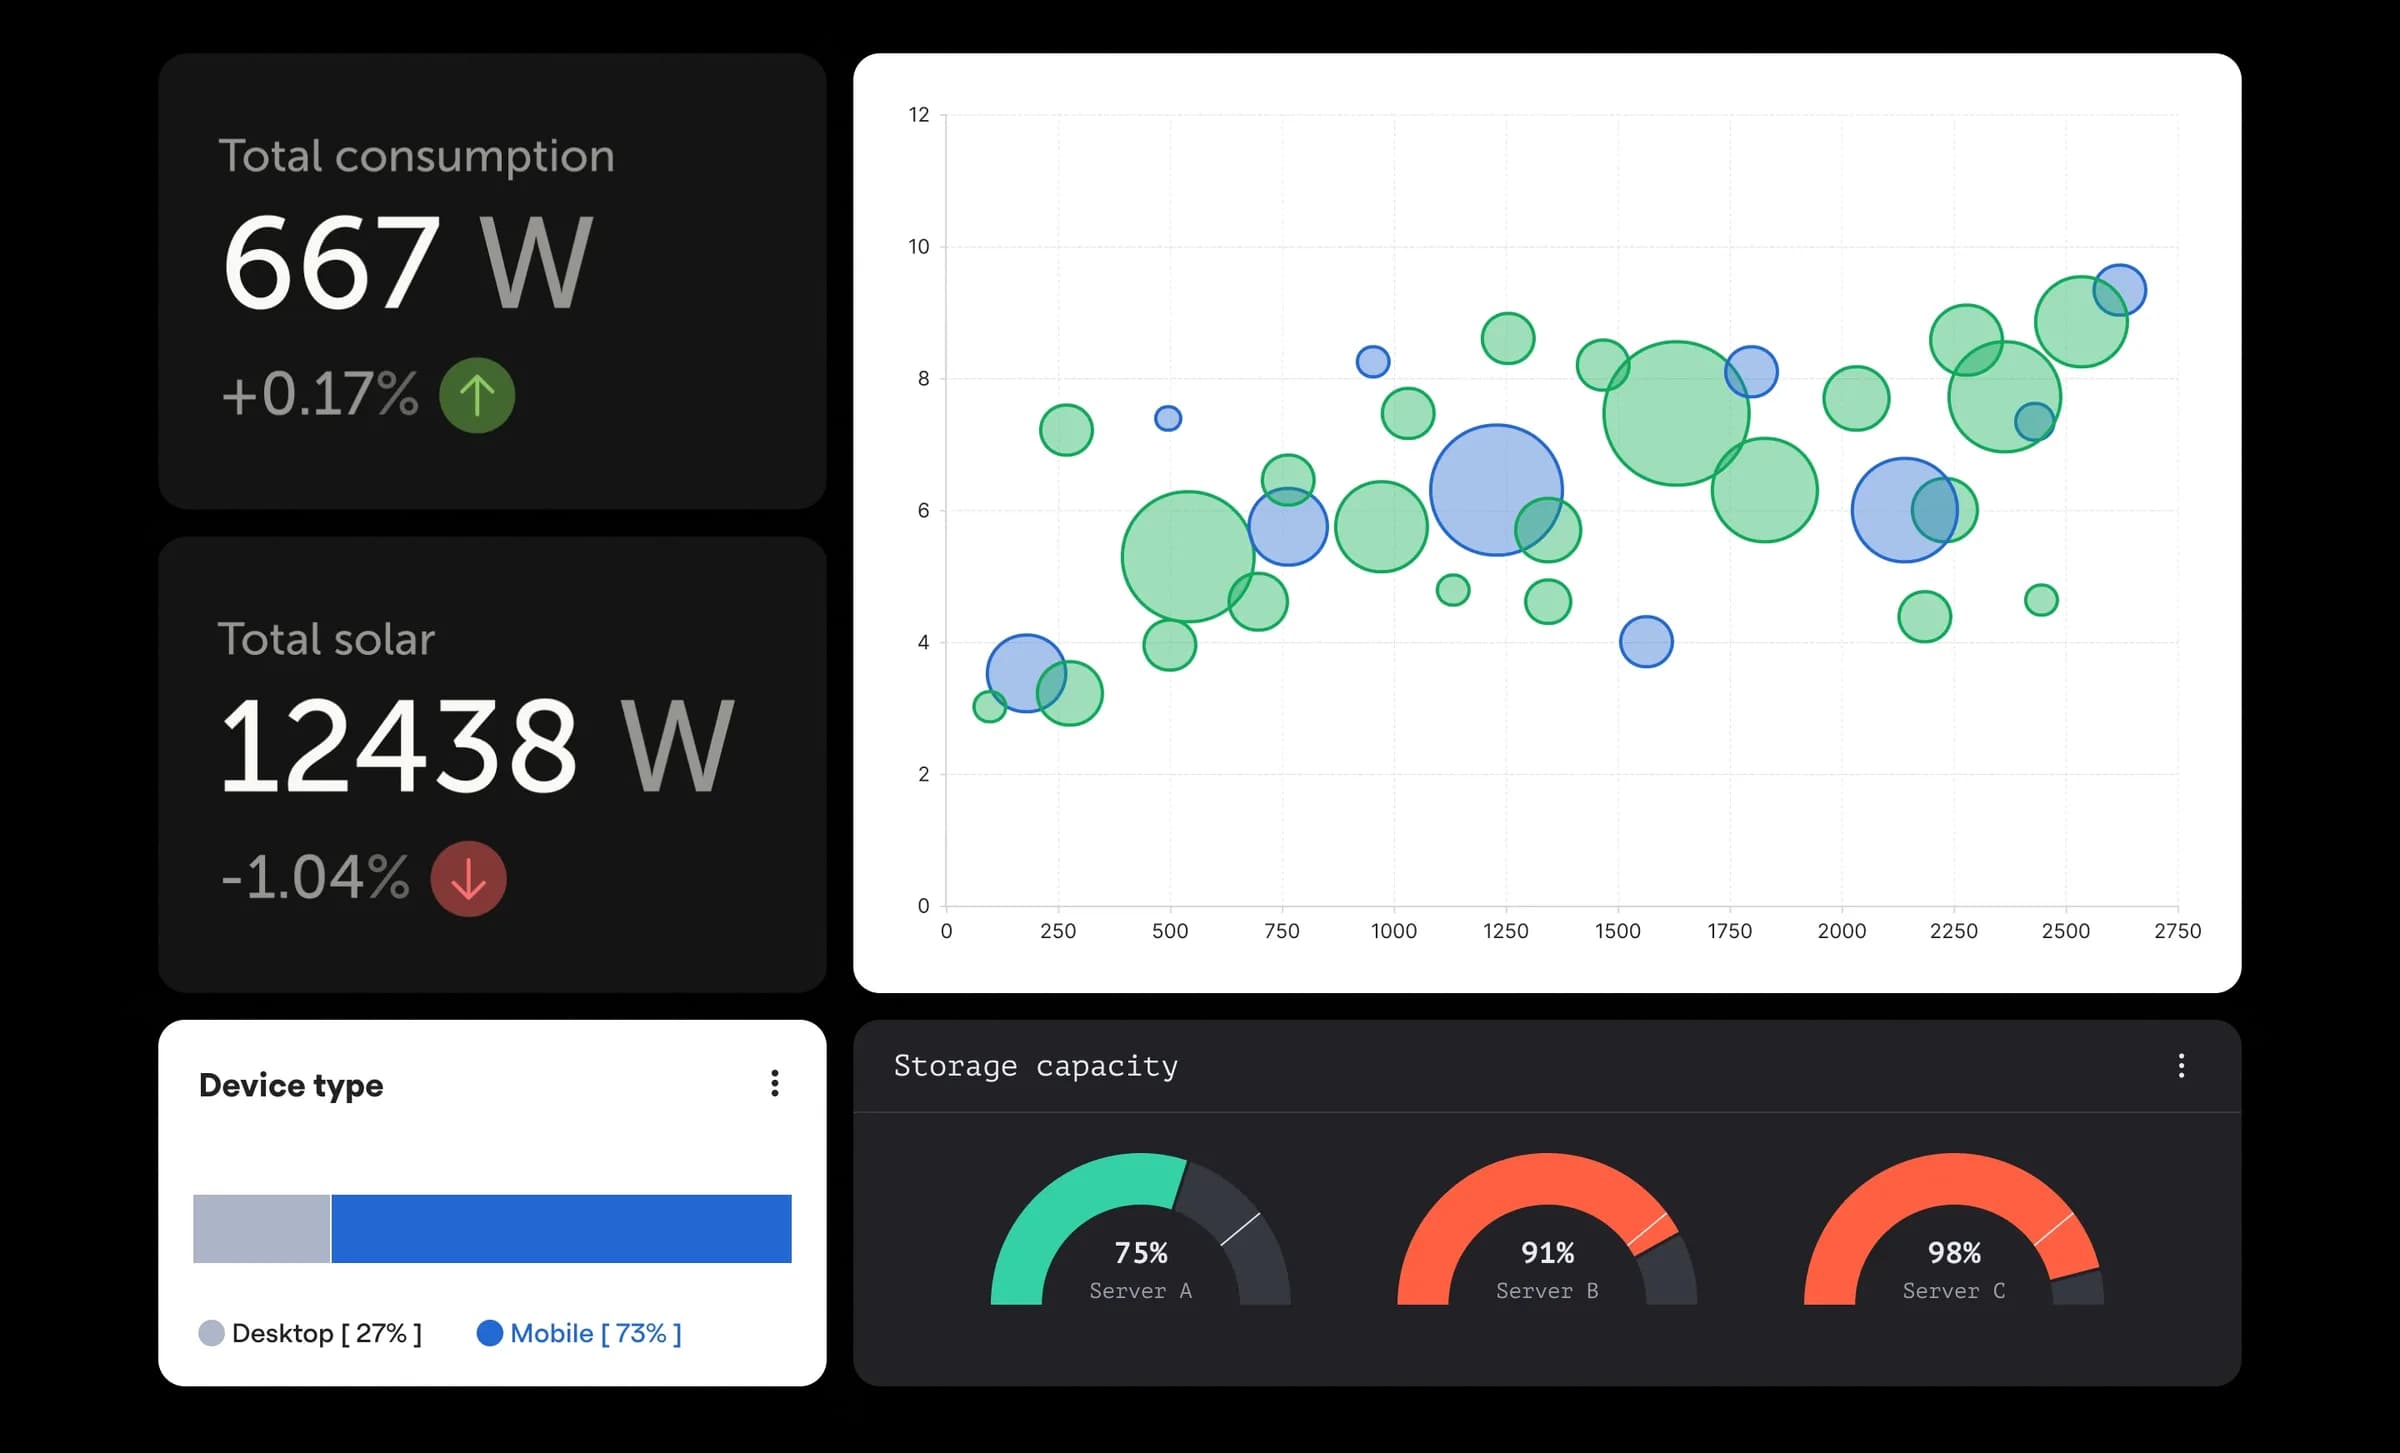
In a world flooded with information, quality data visualisation provides clarity. It simplifies complex datasets into easily understandable insights, enabling informed decision-making and driving business success. Whether you’re showing the status of an energy system or looking for a quick overview of job applicants, the power of good data visualisation is obvious.
1 – Know your audience
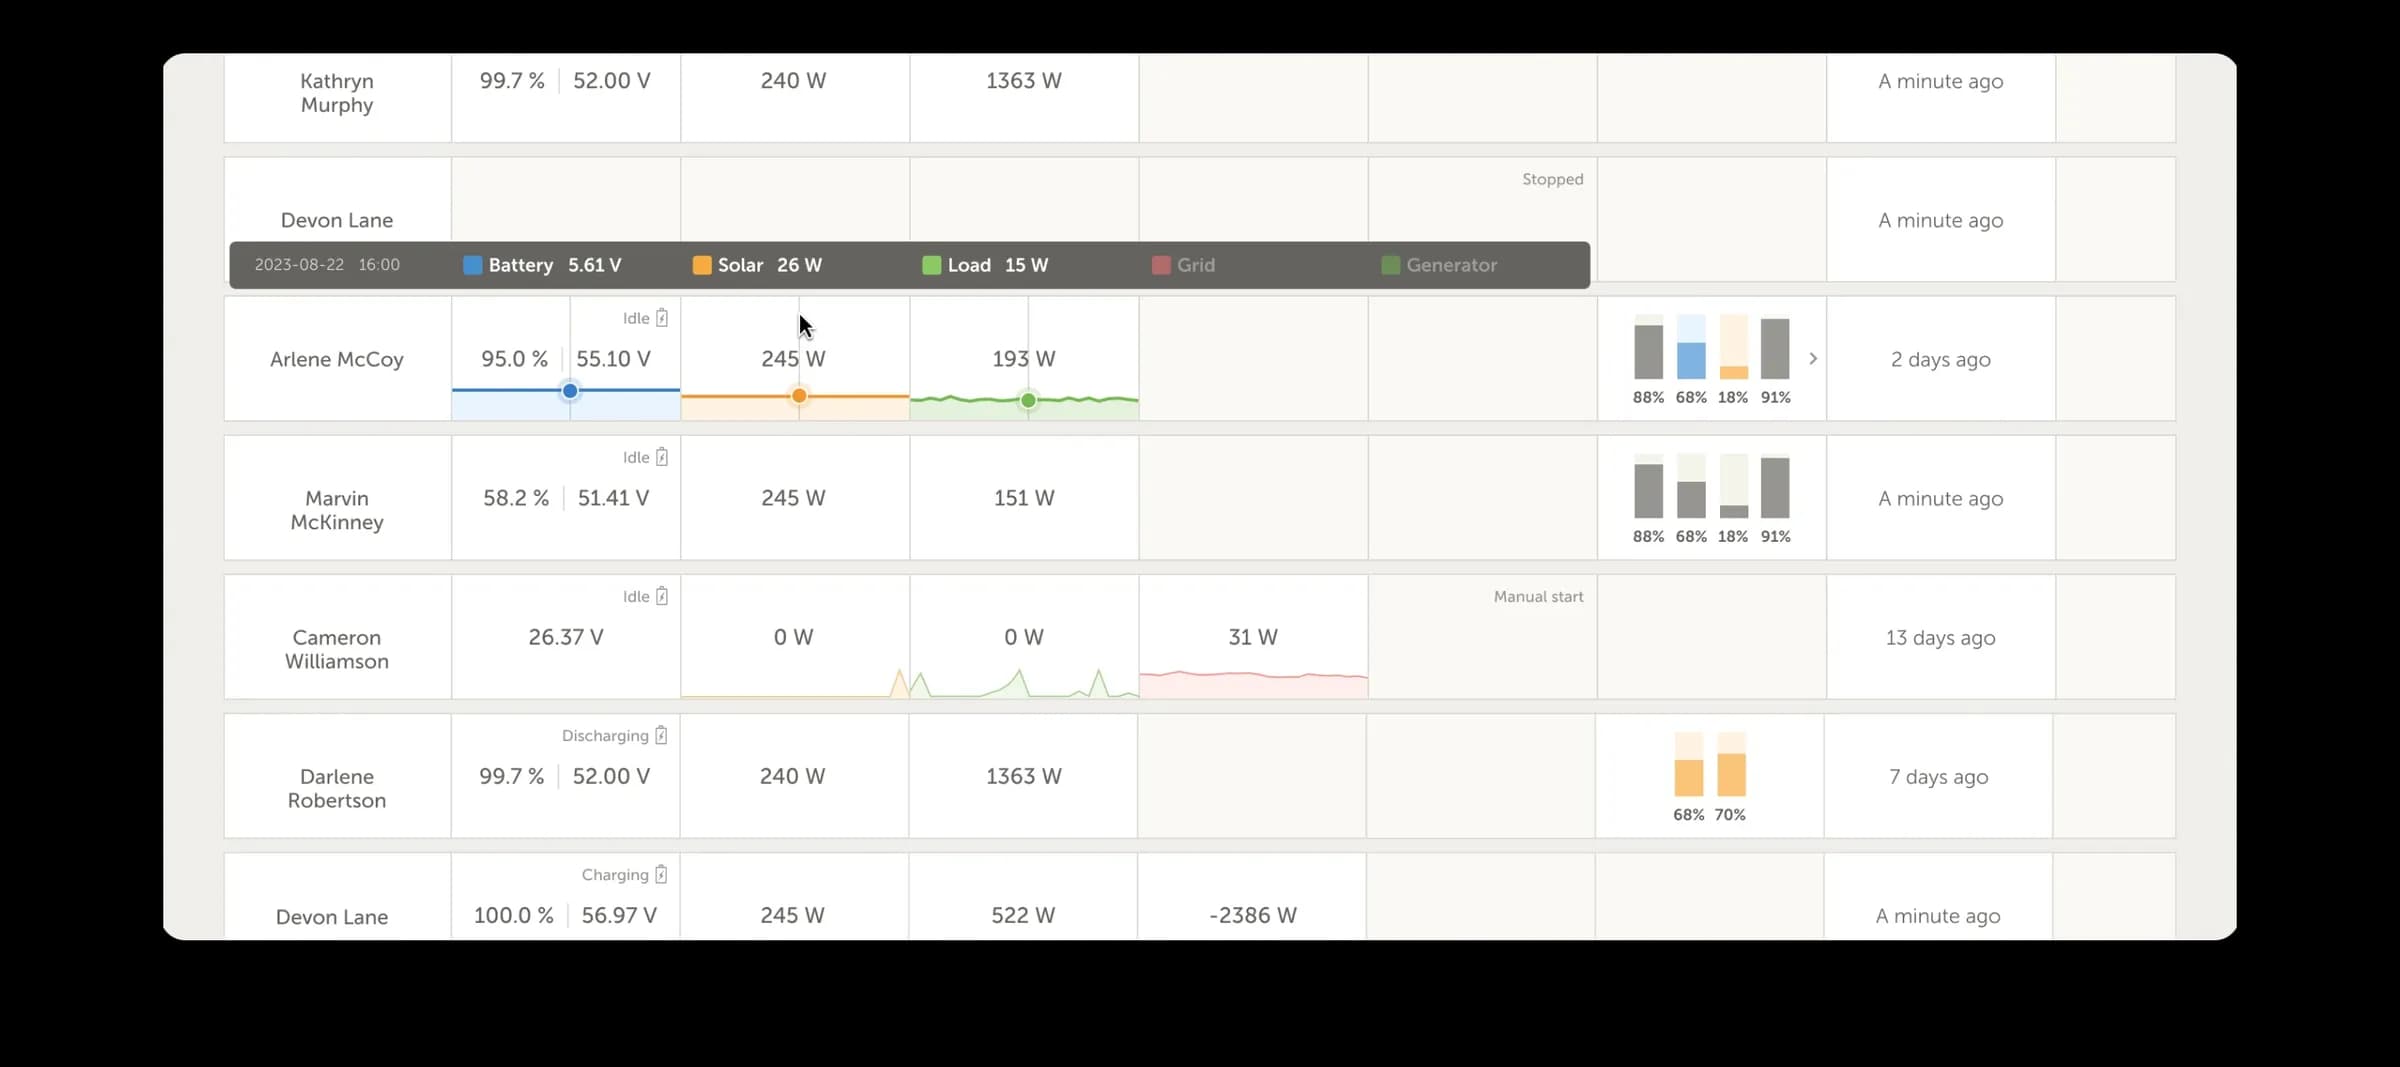
Before diving into the world of data visualisation, it's crucial we understand your audience. Are you presenting data to a communication department that needs high-level insights, or to electrical installers who require granular details? Tailoring the visualisations to resonate with your audience ensures maximum impact and engagement.
Adapting to your audience underscores the importance of accessibility. It means making charts and graphs easy to see and understand for everyone. That includes using clear colours, adding descriptions for images, and making sure everything works with just a keyboard. It's about organising data neatly, adding labels, and letting users customise their view. By focusing on accessibility, we make data visualisations inclusive and useful for everyone.
2 – Choose the right visualisation
With a variety of visualisations available, choosing the right one can be overwhelming. From straightforward donut charts to complex combinations of visualisations, each offers distinct solutions to different requirements. We consider factors such as your target audience, data complexity, interactivity needs and aesthetic preferences when selecting the right visualisation.
3 – Clean and prepare the data
"Garbage in, garbage out" also applies the world of data visualisation. Before creating the visualisations, it's essential to clean and prepare the data to ensure accuracy and reliability. This includes removing duplicates, handling missing values, and standardising formats.
Our data science team is able to fetch the data from your systems and pays attention to providing the best foundation for meaningful insights which saves time later in the process. We also have the knowledge to tailor the data and provide deep analysis for your business. Hence, allowing it to be more efficient by proposing unforeseen services.
4 – Design with purpose
Effective data visualisation is as much about design as it is about data. Each element of the visualisation should serve a purpose, guiding the viewer's attention and conveying key insights. That’s why we pay close attention to colour choices, typography, and layout to create visually appealing and informative visualisations.
Aligning data visualisation with your brand guidelines ensures consistency and reinforces brand identity. By using brand colours and fonts, the visual elements effectively communicate while resonating with the brand's personality and values.
5 – Tell a compelling story
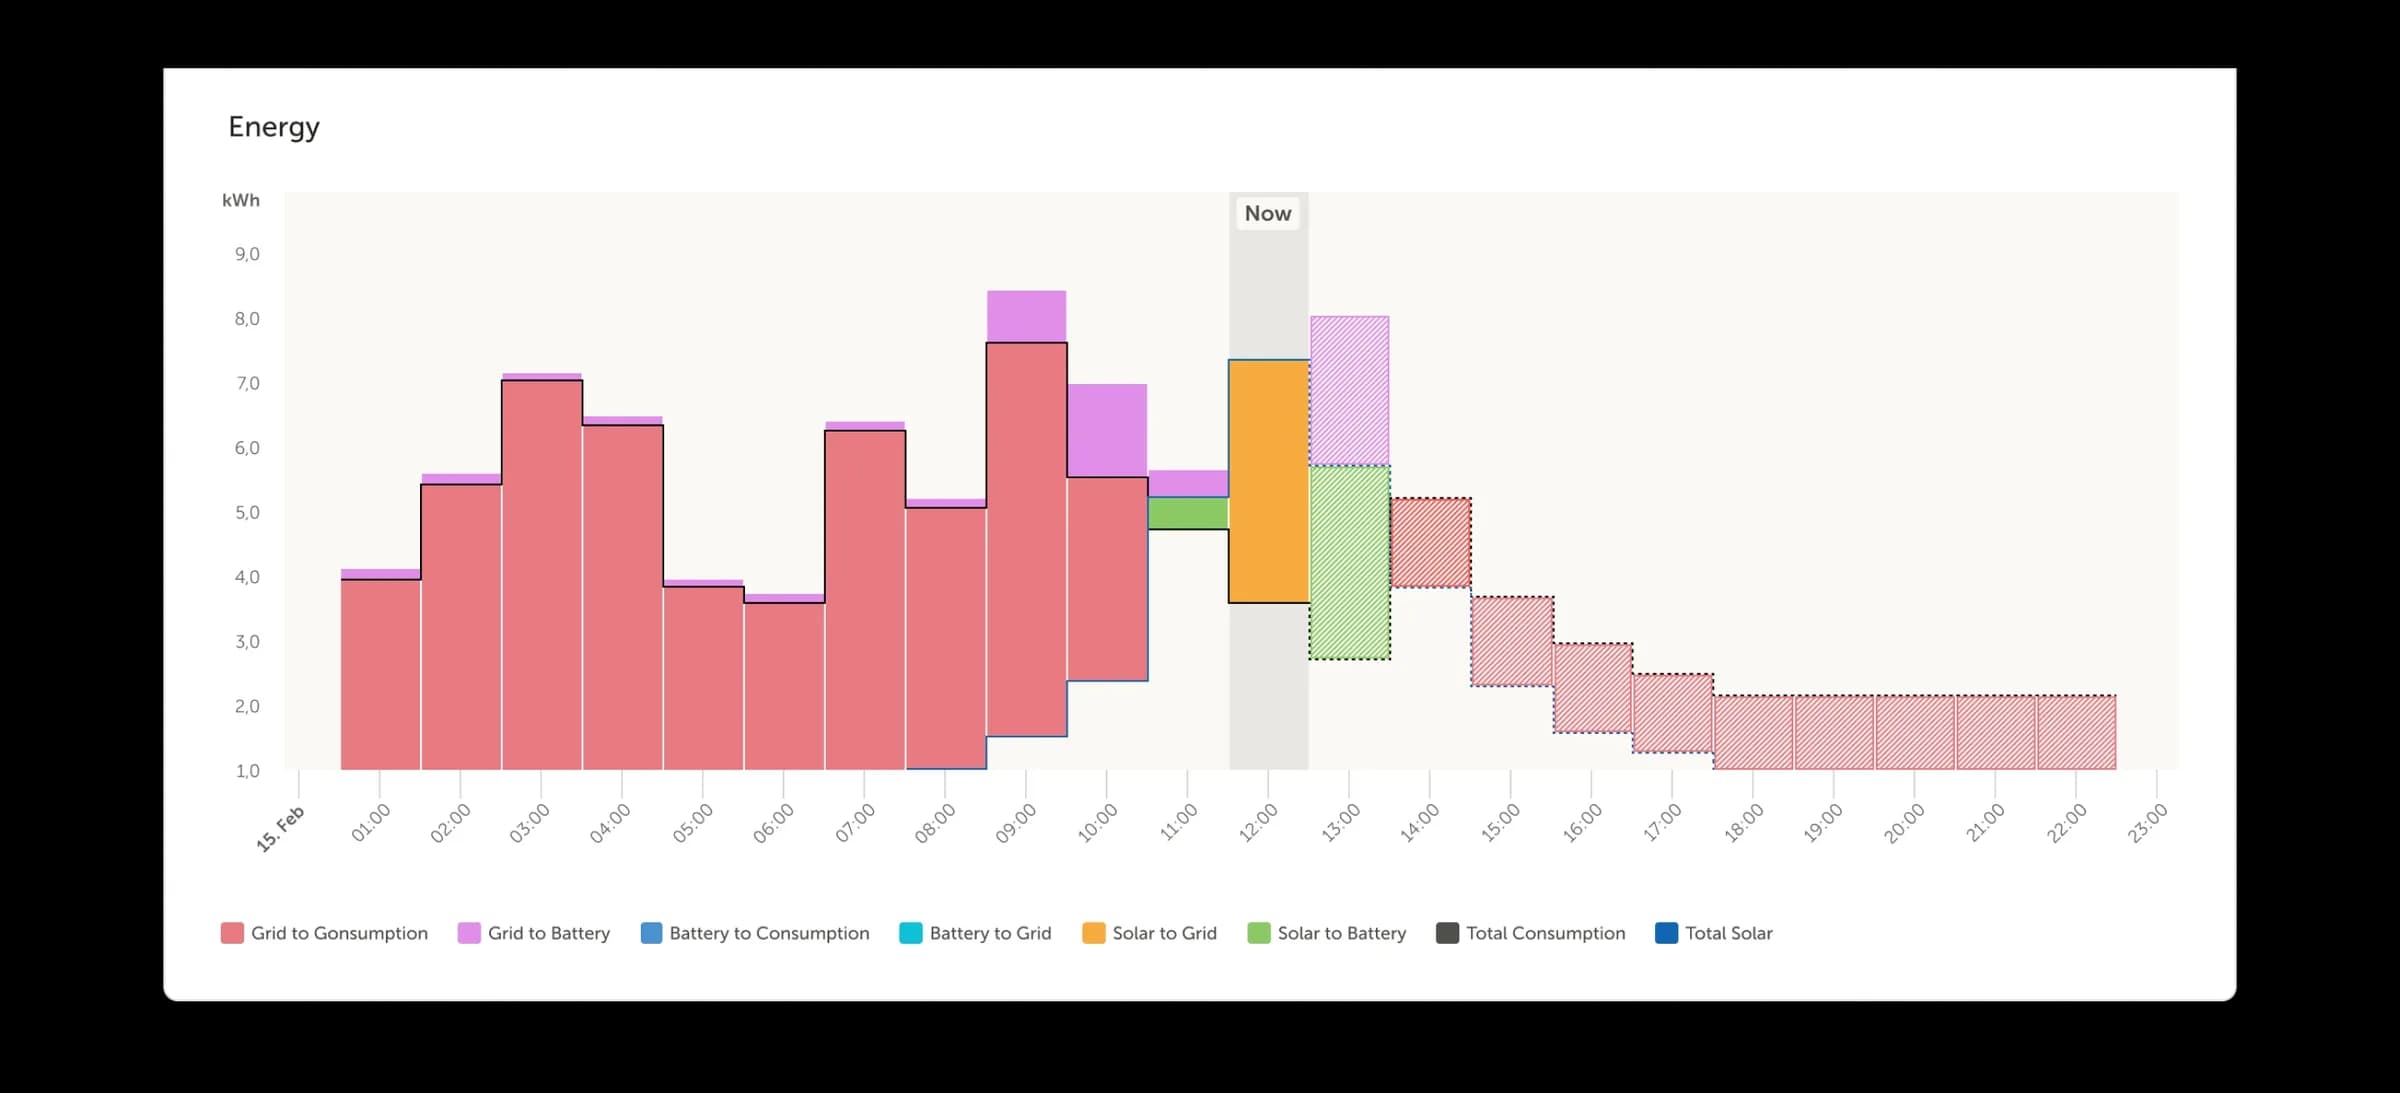
Data visualisation is more than just presenting numbers; it's about storytelling. Consider the story you want to convey and structure your visualisations accordingly. Whether it's highlighting a trend, showcasing a correlation, or revealing an anomaly, storytelling adds depth and context to your data.
6 – Iterate and refine
Achieving quality data visualisation is an iterative process. We research different visualisation techniques and involve your audience. This ensures we exceed the expectations of your audience, while aiming for clarity and impact with each iteration.
Conclusion
In today's data-driven world, the ability to effectively visualise your information is essential. By following these six steps — knowing your audience, choosing the right visualisation, cleaning and preparing your data, designing with purpose, telling a compelling story, and iterating and refining — we unlock the power of data within your organisation.